
Unit 8: Human spaces around the world
1. Spatial distribution of the world's population
2. Natural movement of population
3. The theory of demographic transition
4. Composition of the population
1. Spatial distribution of the world’s population
In this unit we will learn why the distribution of the world population is so unequal, how population increases or decreases are calculated, and how factors such as migratory movements in societies influence. Human geography provides us with important tools to analyze our present and predict our future.
1.1) Population density.
According to the World Bank, the world population in 2019 is 8,000 million people (8 billion). Although it looks like a lot of people, there are very densely populated places and others practically deserted. The city of Kowloon, in Hong Kong, has a density of 43,000 inhabitants per square kilometer, while Greenland has a density of 0.026 inhabitants / km2.
Population density gives us an idea of how close people live. It is found by dividing the number of inhabitants by the surface in km2 (it can be from a city, a country, a continent ...).
The most densely populated areas in the world are South and Southeast Asia, Western Europe, the east coast of the USA and some isolated points, such as Mexico City, Sao Paulo, Lagos, etc. The areas with the lowest population density logically correspond to deserts, poles, high mountain areas and equatorial jungles.
1.2) Population distribution factors.
The fact that people prefer to live in one place over another is not arbitrary. There are physical and human factors.
Physical: people prefer to live on flat terrain, temperate climates, near the sea, where there is a fresh water supply, fertile soil and an abundance of natural resources.
Human: people prefer to live in politically stable places, where work and industry abound, or with fertile soil for agriculture, or near wealth-generating mining operations.

Even though this neighborhood was torn down in the early 90s, still the city of Kowloon, in Hong-Kong, China, is the most crowded city in the world, with a density of 43000 per km2

Greenland is the populated autonomous region with the lowest density: 0.028/km2
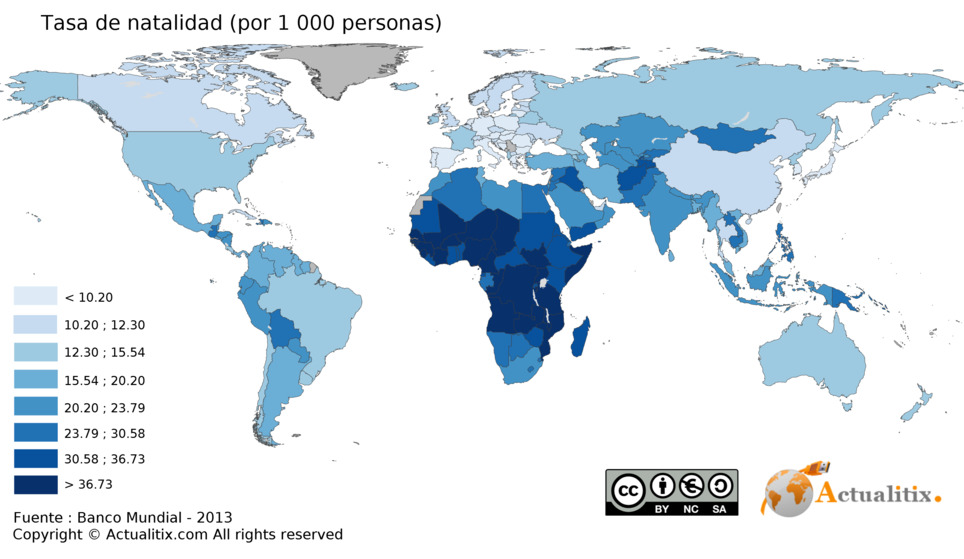
World's population density map 2019
2) Natural movement of population.
Changes in population are due to three factors: births, deaths and migrations.
2.1) Natality.
By studying the birth rate we can see if instead people tend to have many children or few, or remain at intermediate levels.
The birth rate tells us how many births there are per 1,000 inhabitants. It is calculated with the following formula:
The result is given in per-thousand (‰), as is usual in this type of rate, and is considered high if it is greater than 30 ‰; it intermediate if it is between 20 ‰ and 30 ‰, and low if it is below 20 ‰.
In matters of natality, the fertility rate measures how many per thousand women have children. The formula is this:
Something you never have to do in science is jump to conclusions. If the fertility rate of a place is high or low it can be due to many reasons:
Biological: such as the age of the mother, or the possibility of being sterile.
Demographic and socioeconomic: such as the percentage of young and old people, the average age of marriage, the cost of maintaining a family, women's work outside the home, access to contraceptives, religious beliefs.
Political: family planning policies, pro or anti-abortion laws, subsidies for large families.
2.2) Mortality
It measures deaths in a population over a period of time. Three rates are used: mortality, life expectancy, and infant mortality.
The mortality rate is widely used and its formula is as follows:
At first glance, the fact that the death rate in developed countries is often higher than in underdeveloped countries might look surprising, but it is entirely logical. Developed countries, as they have a good health system, have a high number of elderly people, so mortality is high. In underdeveloped countries, precisely because living conditions are not so good, there are few old people and many young people, who are generally strong and resist diseases well, so the mortality rate is lower.
The formula for the life expectancy is as follows:
The infant mortality rate has this formula:
In this case, the rate of underdeveloped countries is notably higher than that of developed ones.
The factors that influence mortality are:
Biological: genetics (hereditary diseases, etc.), gender (women live longer than men), etc.
Demographic and socioeconomic: percentage of old and young, economic and cultural level, personal hygiene, lifestyle, diet, etc.
Political: provision of sanitation, drinking water, public health, etc. by governments.
2.3) Natural growth rate.
It tells us whether the population of a country increases or decreases. It is calculated by subtracting the birth rate minus the death rate. If the result is negative, then it means that that country loses population.


3) The theory of demographic transition.
Population changes are highly dependent on historical events. The world population has always been increasing, except for the years of the Black Death (1348-1352, approx.), But before the industrial revolution (around 1775) it did so very slowly. The most industrialized countries have since experienced a sharp increase in population due to the decline in mortality, and the least developed countries experienced it later, when they began to industialize.
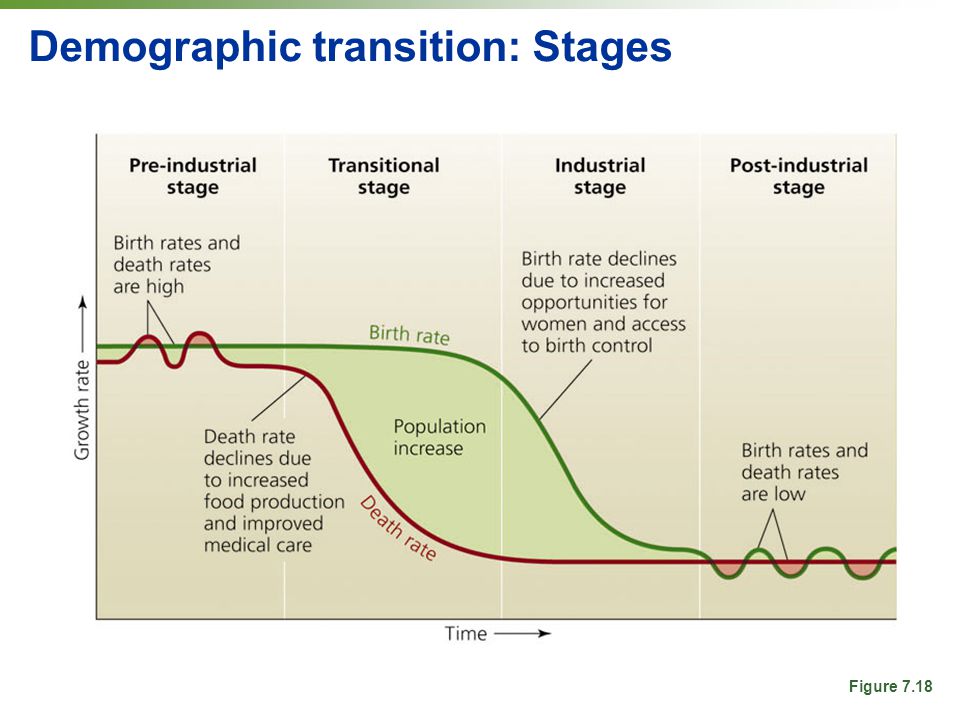
We call "demographic transition" the change in the demographic model that has taken place from the pre-industrial society to the current one. In developed countries, this transition has gone through four phases:
1- Pre-industrial (before 1775):
high birth and death rates. There are many diseases and medicine is not very advanced. Food production is often reduced by poor harvests.
2- Incipient industrialization:
High birth rate and low mortality rate (increased food production, invention of vaccines, etc.)
3-Industrial maturity:
The death rate remains low and the birth rate begins to drop. This is the result of advances in medicine, social insurance and a new society in which children are not thought to have to work.
4-Industrialized or post-industrial society:
It is the present moment: both birth and mortality are low. Perhaps mortality rises slightly as a result of aging societies.
The majority of undeveloped countries are nowadays in the 2nd phase.
The current demographic regime that we can observe in our societies is reflected in:
Low birth rate: In general, few children are born. This is because families no longer think about having children as a labor force; that religious beliefs against contraceptives are not so strong today; to the generalization of the use of contraceptives (family planning); to the incorporation of women into the labor market; that people have other goals in life that are not just having children, and a long etcetera.
Low mortality rate: As for infant mortality, it has decreased dramatically in the last 70 years. The reasons are, above all, the generalization of vaccines, improved hygiene, better nutrition, family planning, etc.
Mortality in adult people has also decreased, especially thanks to hygiene measures and the improvement of health systems. However, as we saw earlier, in developed countries the mortality rate may be higher than in underdeveloped countries because those have much more elderly people who, despite the good health system, are more likely to get sick and die than young people, and it is in underdeveloped countries where there are more young people.
Life expectancy is getting higher, but low birth rates make natural growth slow, even negative in Europe.
The result is the largest population explosion in history, as the graph shows.

4) Composition of the population.
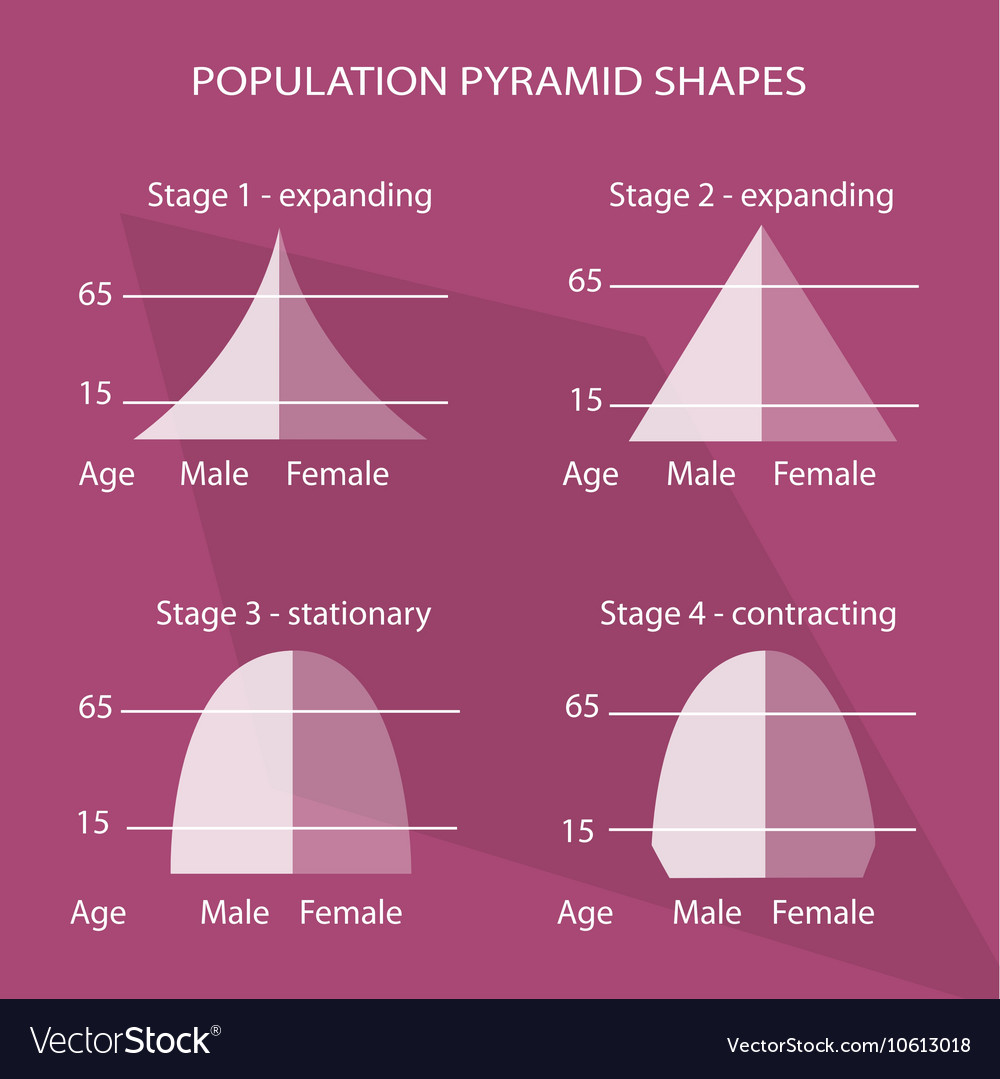
The population can be studied from many variables, but in Geography we are especially interested in how the population is distributed by gender and age. With these data, population pyramids can be created that offer us a simple demographic panorama to analyze.
Population by gender:
In general, more boys than girls are born, but men die earlier, so the pyramid stabilizes as age advances.
Population by age:
In general, the adult population tends to predominate in the world.
The abundant young population is typical of underdeveloped countries, which are now beginning their demographic transition. The overabundance of young people results in hunger, illiteracy or unemployment, which is why many people choose to emigrate to other countries. These factors also provoke social conflicts in those countries.
The adult population is typical of emerging countries, such as those in Asia or Latin America.
This occurs in countries that are completing their demographic transition.
Natural growth is moderate and the population of working age very high, which also causes migrations.
The aging population is typical of developed countries in Western Europe, the United States, Canada, Japan, South Korea, Australia or New Zealand. These countries have already completed their demographic transition. The fact that there are many elderly people leads to a lack of labor and high expenses in pensions and health. The labor force is supplied by immigrant workers, who in turn generate taxes with which to pay expenses in pensions and health.


"The power of population is so superior to the power in the earth to produce subsistence for man, that premature death must in some shape or other visit the human race."
Thomas R. Malthus, An essay on the principle of population, 1798
A very peculiar case: United Arab Emirates 2019's population pyramid. There is a clear imbalance between the male and female population in the working ages, between 20 and 65 years. This is because this country, like others in its environment such as Qatar or Kuwait, host a lot of male immigration to work in construction.